Fact sheet · Analytics & Data

Grafana Cloud
Grafana Cloud is an AI-powered observability platform that unifies metrics, logs, traces, profiles, and business data on open standards without vendor lock-in.
Grafana Cloud is an AI-powered observability platform that unifies metrics, logs, traces, profiles, and business data on open standards without vendor lock-in.
Overview
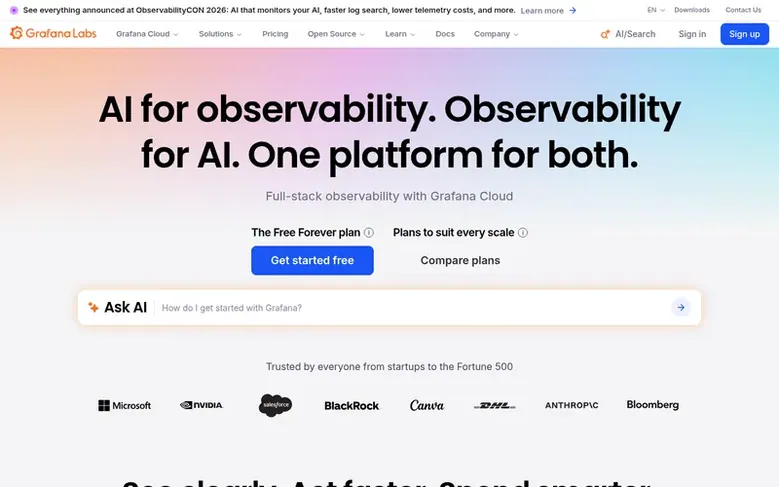
Grafana Cloud is a fully managed observability platform that helps teams connect disparate data to act faster. Built on open standards like OpenTelemetry and Prometheus, it enables visualization and analysis of metrics, logs, traces, profiles, and business data across infrastructure, applications, and AI systems.
The platform includes AI-powered tools like Grafana Assistant for understanding production telemetry and Investigations for root cause analysis. Adaptive Telemetry automatically identifies valuable data and reduces costs by up to 80%, while hundreds of plugins and integrations allow connection to existing tools without rip-and-replace requirements.
Grafana Cloud serves startups to enterprises with three tiers: Free Forever for exploration, Pro starting at $19/month for scaling teams, and Enterprise with premium support and custom deployment options. The platform is trusted by over 10,000 customers and recognized as a Leader in the 2026 Gartner Magic Quadrant for Observability Platforms.
Feature facts
- AI Assistant for understanding production telemetry
- Adaptive Telemetry for cost optimization
- Hundreds of plugins and integrations
- Incident response and management
- Kubernetes monitoring
- Frontend and real user monitoring
- Synthetic monitoring and testing
- Database observability
- Dashboards and visualization
Follow Grafana Cloud: their milestones, new launches and awards come to you by email, once a day by default.
Grafana Cloud specifications
| Section | Analytics & Data |
|---|---|
| Stage | Established |
| Website | grafana.com |
| Makers | Raj Dutt (Founder and CEO) |
| Votes2 | 0 |
Grafana Cloud metrics
| Metric | Value |
|---|---|
| Domain Rating | 89 no change since last check |
| Trust Flow | 46 no change since last check |
| Citation Flow | 66 no change since last check |
| Referring domains | 27,848 no change since last check |
| External backlinks | 694,558 no change since last check |
Fact: Ahrefs Domain Rating checked 20 Nov 2026, fact changed 3 Oct 2026. Fact: top topic Regional/Europe (43). Fact: Majestic checked 3 Oct 2026, fact changed 3 Oct 2026. Link facts from Majestic. Trust Flow, Citation Flow and Topical Trust Flow are trademarks of Majestic-12 Ltd.
Grafana Cloud domain fact sheet
Open the fact sheet
| Domain age | 12 years |
|---|---|
| Registered | |
| Expires | |
| Registrar | eNom, LLC |
| DNSSEC | Not signed |
Grafana Cloud launch receipt sheet
What we have measured for Grafana Cloud since it went live on SaaS Directory Info on 3 October 2026.
- 89 Domain Rating (Ahrefs) no change since launch
at launch: 89 (3 Oct 2026); latest: 19 Nov 2026 - 46 Trust Flow (Majestic)
first measured 3 Oct 2026 - 27,848 Referring domains (Majestic)
first measured 3 Oct 2026
Checkpoints
- Day 302 Nov 2026DR 89 no change since launch0 visits sent
Day 47 since launch. Next receipt: day 60, 2 Dec 2026. The figures report a change; they do not say what caused it, and many things can. No figure here is a guess.
Got a launch coming up?
Step-by-step tips for before, during and after your launch, free to read on SaaS Directory Info.
- Prepare
- Launch day
- Launch week
- Next steps
Compare and explore
Frequently looked up
- Q1Do I need an OpenTelemetry Collector to use Grafana Cloud?
- For production environments, yes, you need an OpenTelemetry Collector. The OpenTelemetry Collector (or Alloy) enables batching, retries, sampling, enrichment, and multi-backend routing before sending data to Grafana Cloud.
- Q2What observability signals can I send from OpenTelemetry to Grafana Cloud?
- You can send metrics for performance and capacity monitoring, logs for debugging and auditability, traces for distributed request analysis, and profiles for insights into system and application behavior. Grafana Cloud can correlate all these signals to speed up root cause analysis.
- Q3What are the benefits of using OpenTelemetry with Grafana Cloud vs. an APM tool with a proprietary telemetry collector?
- By pairing OpenTelemetry and Grafana Cloud, you get a vendor-neutral telemetry standard, flexible routing, full signal coverage (metrics, logs, traces, profiles), scalable storage, and powerful analysis tools. This lowers vendor lock-in and gives teams visibility across complex distributed systems.
- Q4Can I get started for free with OpenTelemetry and Grafana Cloud?
- Yes. Grafana Cloud provides a free tier that supports OpenTelemetry ingestion and core observability features. It is ideal for proof-of-concepts, small deployments, or early stage observability workflows before scaling to paid tiers. You can sign up in minutes with no credit card required.
Leave a review for Grafana Cloud
Review count for Grafana Cloud: none yet. Add the first.
Fact: reviews are free and cannot be bought. All reviews, in brief
Reviews and facts · Fact updates · Share these facts · Your SaaS? Claim this fact file · Report a wrong fact
Grafana Cloud has a free listing. The owner can unlock the full profile with a paid launch for $5:
- Founder story (locked)
- Milestones (locked)
- Demo video (locked)
- Dofollow website link: not on this free listing (its website link is nofollow)
See also
| Product | Origin | DR1 | Votes2 |
|---|---|---|---|
 Why that moveChess game reviews that explain every move in plain language. Free to start: 100 credits, plus 50 every Monday. | not stated | 0 | 4 votes. Log in to vote for Why that move in the file |
 BerserkObservability engine built on object storage for logs, metrics and traces | Denmark | 2 | 3 votes. Log in to vote for Berserk in the file |
 Okidoki AnalyticsPrivacy-first analytics that never collects personal data and requires no cookie banner | Sweden | 0 | 0 votes. Log in to vote for Okidoki Analytics in the file |
 DataPoriumInvestment data platform for stocks, ETFs, crypto, Congress trades, layoffs, real estate and the US economy | United States | 3 | 0 votes. Log in to vote for DataPorium in the file |